7 Infographic
7.1 Introduction to Wireframes
7.1.1 What’s a Wireframe?
A wireframe is like a blueprint for digital projects. It shows the basic layout and visual components of websites or apps without fancy colours or designs.
7.1.2 Why Use Wireframes?
- Plan Your Design: Sketch out your ideas quickly
- Focus on Structure: Arrange elements without getting distracted by colors or fonts
- Improve Teamwork: Help everyone understand the project’s structure
- Save Time: Spot and fix problems early
7.2 Layout Structures to Be Considered for Baseball Player Infographic
When designing a baseball player infographic, it’s important to structure the layout in a way that highlights key information while maintaining visual appeal. Below is a suggested layout guide, with additional considerations for enhancing clarity and organisation:
Header Section: Display the main idea of the infographic.
Possible arrangements:
- Left: Display the player’s jersey number for quick identification.
- Centre: Feature the player’s full name in bold, prominent text to capture attention.
- Right: Include the team logo to ensure team representation and brand recognition.
Left Sidebar: Present key statistics about the player.
Possible arrangements:
- Top: Display the player’s main statistics (e.g., home runs, RBIs) in a vertical format for clarity.
- Bottom: Include less prominent statistics or additional information like averages.
Main Content Area: Showcase a large visual representation of the player.
Possible arrangements:
- Centre: Feature a large action photo of the player to capture attention.
- Below the photo: Add the player’s signature or name to personalise the infographic.
- Under the name: Include a short biography or highlight reel of their career.
Right Sidebar: Illustrate achievements and memorable moments.
Possible arrangements:
- Top: Use smaller images or icons to represent awards, titles, or key moments.
- Bottom: Provide supporting data for these achievements, such as season highlights or individual accolades.
Footer Section: Display a timeline and additional resources.
Possible arrangements:
- Left: Show a career timeline, outlining important milestones such as the player’s debut or awards.
- Right: Include social media icons or a website link for further exploration and fan engagement.
7.2.1 Additional Layout Considerations:
Include only if it contributes to the overall structure and clarity of the layout.
- Multiple Columns: Consider dividing content into multiple columns for better organisation and readability. For example, use a two- or three-column layout to separate player stats, visuals, and achievements.
- Spacing: Ensure there is sufficient spacing between elements to avoid a cluttered look. This will help with readability and visual flow.
- Text Alignment: Use consistent text alignment (e.g., centre-aligned for headings, left-aligned for body text) to maintain a cohesive design.
- Consistent Typography: Limit font styles to one or two for consistency and readability.
7.3 Wireframe Examples
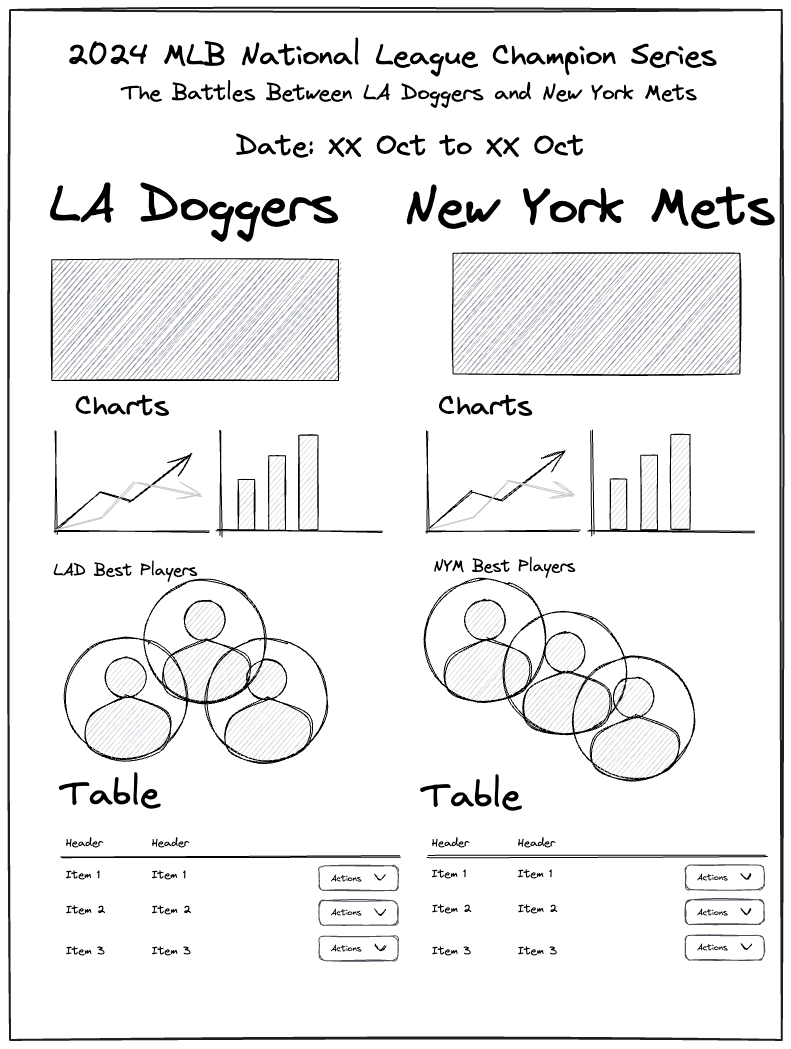
7.3.1 Wireframes for Posters

- Prioritise the layout structure.
- Add annotations for clarity where needed.
- Focus on visual components and data presentation.
- Avoid including styling details at this stage.
7.3.2 Wireframes for Websites
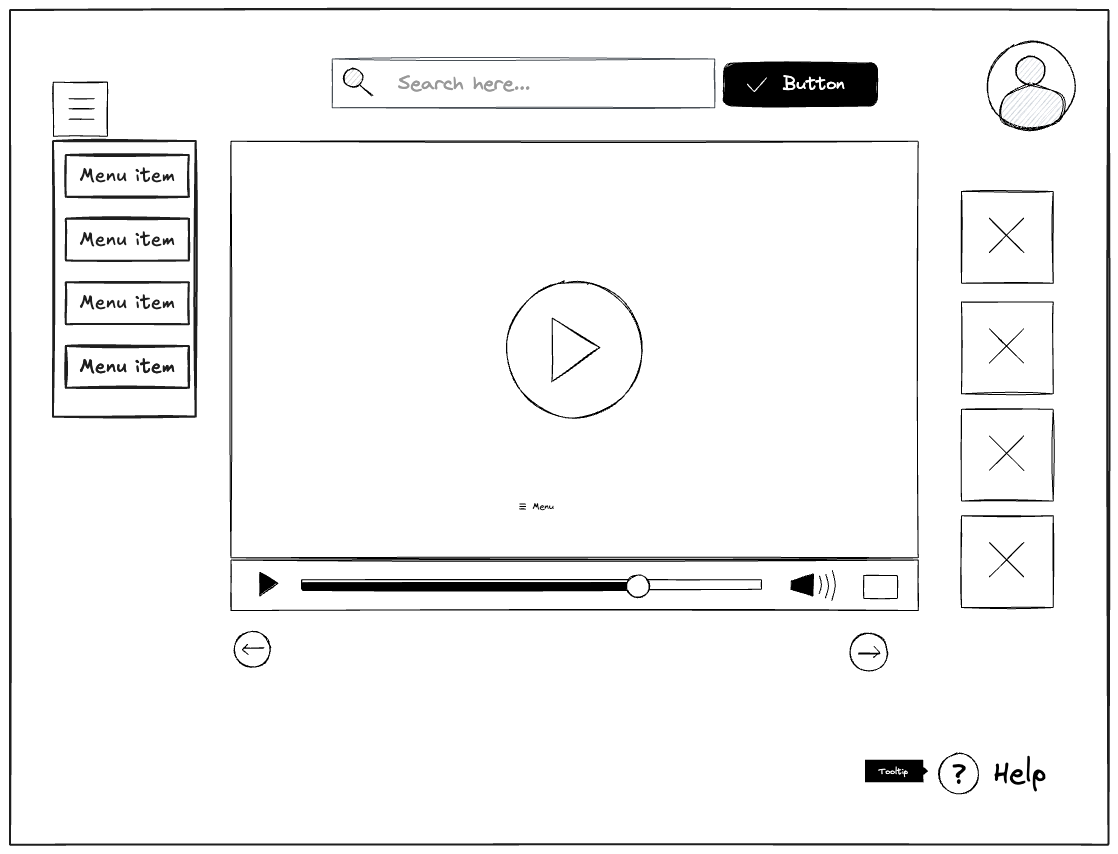
- List all the visual components.
- Identify any parts you find unclear or hard to name.
- Suggest improvements to make the wireframe easier to understand.
Source: YouTube. https://www.youtube.com/watch?v=O1Kqxw07VWM. Accessed 13 Oct. 2024.
7.4 Key Design Considerations for Students:
- Hierarchy of Information: Ensure the most important elements (name, key stats, action photo) stand out.
- Visual Flow and Readability: Guide the viewer’s eye naturally from the header to the footer.
- Balance Between Elements: Maintain an even distribution of text and images, leaving some white space for visual clarity.
- Consistency in Design: Use uniform colours, fonts, and styles to create a cohesive design.
- Personalisation: Adapt the layout to suit the player’s unique achievements and personality.
You are encouraged to iterate on this design, using the wireframe as a foundation. You can adjust to fit your chosen player, ensuring the layout is visually appealing while effectively communicating the player’s story and accomplishments.
7.5 Wireframes vs Mock-ups: What’s the Difference?
| Wireframes | Mock-ups |
|---|---|
| Black and white | Full color |
| Basic shapes | Detailed graphics |
| Focus on layout | Focus on visual design |
| Early planning stage | Later design stage |
| Quick to create | Take more time to make |
Remember: Wireframes are about structure, while mock-ups show how the final product will look!
7.6 Excalidraw for Wireframing
- Please use Obsidian Excalidraw Plugin
- Excalidraw Online
7.7 Assessment Task - MLB Postseason Infographic
- Decide your topic
- Collect data and create statistics
- Create wireframes
- Create Ingographic
Example:
Topics:
Here are five cool ideas for your MLB postseason infographic posters. Since you’re not super familiar with MLB, these topics will give you a good starting point. Choose one that you like and get creative with it!
World Series Showdown: American League vs National League
Create a poster about the final championship series. Highlight the best teams from each league, the star players, and the exciting moments that make the World Series so epic.MVP Performances: Top Players in the 2024 Postseason
Focus on the best players in the postseason. You can show their stats, key plays, and explain why they’re being talked about as potential MVPs.Biggest Upsets of the 2024 MLB Postseason
Tell the story of underdog teams that surprised everyone by beating the favourites. Use stats and key moments to show how they pulled off these big wins.The Best Home Runs of the 2024 MLB Postseason
Who doesn’t love a big home run? Showcase the most exciting home runs in the postseason, including how far they went and how they impacted the games.Pitching Duels: Top Pitchers in the 2024 Postseason
Focus on the pitchers who dominated this postseason. You can compare their stats, like strikeouts and earned run averages (ERA), and highlight the key moments where they came out on top.
Pick one of these topics, dive into the stats, and make your poster stand out!
7.8 Credit
‘Wireframe vs Mockup vs Prototype: What’s the Difference?’ Sketch, 8 Apr. 2022, https://www.sketch.com/blog/wireframe-vs-mockup-vs-prototype/.