3 Data Collection for Research
3.1 Understanding Research
- Formulate theory or research questions
- Collect and analyse data
- Interpret results
- Present findings
3.2 Formulate theory or research questions
To start your project, come up with a clear research question about baseball. Think about what you’re curious about in MLB – maybe it’s how players perform, team strategies, or interesting patterns in the game’s history. Your question should be specific enough to answer with data, but also interesting to explore. For example, you could ask, “How has pitching speed changed in MLB over the last 10 years?” A good question will help you decide what data to collect and analyse next. Remember, the better your question, the easier it will be to guide your research through all the following steps.
3.3 Data collection methods
Surveys: Gather information from many people using questionnaires.
Example: Send an online survey to 1000 MLB fans asking about their favourite pitchers and perceived changes in pitching speeds over time.
Focus groups: Conduct guided discussions with small groups to explore opinions.
Example: Gather 8-10 retired MLB pitchers to discuss how pitching techniques and speeds have evolved in the last decade.
Interviews: Have one-on-one conversations to get in-depth information.
Example: Interview the pitching coach of the New York Yankees about training methods used to increase pitching speeds.
Observation: Watch and record behaviour or events as they happen.
Example: Attend 20 MLB games over a season, using a radar gun to measure and record pitching speeds firsthand.
3.4 Types of Data
Terminology Difference in Maths and Applied Computing
For research in Applied Computing, we are dealing with either quantitative or qualitative data.
graph TD
    A[Types of Data] --> B[Numerical Data]
    A[Types of Data] --> C[Categorical Data]

    B --> D[Discrete]
    B --> E[Continuous]

    C --> F[Nominal]
    C --> G[Ordinal]

    D --> H[how many people in your family]
    E --> I[how tall are you? 175.25]

    F --> J[eye colour]
    G --> K[size of your shoes]

    style B fill:#f9f,stroke:#333,stroke-width:2px
    style C fill:#f9f,stroke:#333,stroke-width:2px
    style D fill:#ff9,stroke:#333,stroke-width:2px
    style E fill:#ff9,stroke:#333,stroke-width:2px
    style F fill:#9f9,stroke:#333,stroke-width:2px
    style G fill:#9f9,stroke:#333,stroke-width:2px

    H --> L[quantity - quantitative data]
    I --> L[quantity - quantitative data]

    J --> M[quality - qualitative data]
    K --> M[quality - qualitative data]

    style L fill:#FFE4E1,stroke:#333,stroke-width:2px
    style M fill:#FFE4E1,stroke:#333,stroke-width:2px

    linkStyle default fill:none,stroke-width:3px,stroke:black
3.4.1 Most common data types for databases
To store data in a database, we need to choose several data types including:
- Text (VarChar/String): For text of fixed or variable length (e.g., names, descriptions)
- Integer: For whole numbers (e.g., age, count of items)
- Numeric (Float/Double): For decimal numbers (e.g., price, measurements)
- Date/Time: For storing dates and times (e.g., birth_date, timestamp)
- Boolean: For true/false values (e.g., is_active, has_subscription)
- BLOB (Binary Large Object): For storing large binary data (e.g., images, files)
3.4.2 Data Types for Storing Pitching Speed Analysis Data
To answer the question “How has pitching speed changed in MLB over the last 10 years”, we would collect and store the following data:
3.4.3 Data Types for Storing Pitching Speed Analysis Data
To answer the question “How has pitching speed changed in MLB over the last 10 years”, we would collect and store the following data:
- Pitch Speed
- Data Type: Numeric (Float)
- Example: 95.6 mph
- Pitcher Name
- Data Type: Text (VARCHAR)
- Example: “Max Scherzer”
- Date of Pitch
- Data Type: Date
- Example: 2024-10-15
- Pitch Type
- Data Type: Text (VARCHAR), Categorical
- Example: “Four-seam fastball”
- Pitcher’s Team
- Data Type: Text (VARCHAR), Categorical
- Example: “Los Angeles Dodgers”
- Pitcher’s Age
- Data Type: Integer
- Example: 29
- Game Situation
- Data Type: Text (VARCHAR), Categorical
- Example: “9th inning, 2 outs”
- Stadium
- Data Type: Text (VARCHAR), Categorical
- Example: “Fenway Park”
- Weather Conditions
- Data Type: Text (VARCHAR), Categorical for description; Numeric (Float) for temperature
- Example: “Clear”, 72.0
By collecting and analysing these data types over a 10-year period, we can get a comprehensive view of how pitching speeds have changed, accounting for various factors that might influence pitch velocity.
3.4.4 Benefits of Using Categories in a Database
Improved Data Integrity
Categories limit data entry to predefined options, reducing errors from typos or inconsistent naming.
Example: Storing “Four-seam fastball” consistently instead of variations like “4-seam” or “Four seam”.
Efficient Storage
Categories can be stored as integers linked to a lookup table, saving space compared to storing full text strings.
Example: Storing pitch types as numbers (1, 2, 3) instead of full names, saving storage space.
Faster Queries
Searching and sorting categorical data is typically faster, especially when categories are stored as integers.
Example: Filtering all “Four-seam fastball” pitches is quicker when searching for a single integer value.
3.5 Mini-Survey Task: Baseball Research in Your Homegroup
In this task, you’ll create and conduct a small survey about baseball within your homegroup. This will give you hands-on experience with data collection, analysis, and understanding different data types.
3.5.0.1 Steps:
Choose an interesting research topic about baseball.
Create a short survey with three to five questions. Ensure at least one question is open-ended.
Before conducting the survey, ask each participant to agree to this consent form:
Conset Form
I agree to participate in this brief baseball survey. I understand that:
- My responses will be anonymous
- The data will only be used for classroom learning purposes
- I can choose not to answer any question
- I can withdraw from the survey at any time
Do you agree to participate? (Yes/No): _______
Signature: _________________ Date: _________
Conduct the survey with at least 5 members of your homegroup.
After the survey, record the responses in a simple table format.
Prepare a brief summary of your findings.
Reflect on the data types you used and how they might be stored in a database.
Remember to thank your participants and respect their privacy by keeping their responses anonymous!
3.6 Primary and Secondary Sources
Primary and secondary sources are two fundamental categories of information used in research and academic studies.
Primary sources are original, first-hand accounts or raw data directly from the time period or event being studied. These can include diaries, interviews, original research papers, photographs, or direct observations. They provide unfiltered, immediate information about a topic.
Secondary sources, on the other hand, are interpretations or analyses of primary sources. These typically include textbooks, review articles, documentaries, or books about historical events. They offer context, background, and expert analysis of primary source material.
While primary sources give direct evidence, secondary sources help researchers understand and interpret that evidence within a broader context. Both types of sources are valuable in research, with primary sources offering authenticity and immediacy, and secondary sources providing depth and perspective.
Check your understanding
Is the data you collected from your homegroup considered a primary or secondary source?
3.7 Referencing and Citation
When you’re writing a report or doing a project, it’s important to give credit to the sources of information you use. This is called referencing or citation. It shows where you got your facts and ideas from.
Why is this important?
- It shows your teacher that you’ve done proper research.
- It allows others to check your sources if they want to learn more.
- It helps you avoid plagiarism (using someone else’s work without giving them credit).
There are different citation styles, but one of the most common is APA (American Psychological Association) style. Here’s how to cite different sources in APA:
Book:
Author’s Last Name, First Initial. (Year of Publication). Title of book. Publisher.Example:
Lewis, M. (2003). Moneyball: The art of winning an unfair game (p. 97). W.W. Norton.Website: Author’s Last Name, First Initial. (Year, Month Day). Title of page. Website Name. URL
Example:
MLB.com Stats. (n.d.). MLB Player Stats 2023. MLB.com. https://www.mlb.com/stats/Software:
Author/Developer. (Year). Software Name (Version number) [Computer software]. Publisher/URLExample:
Project Jupyter. (2023). JupyterLab (Version 3.6.3) [Computer software]. https://jupyter.org/
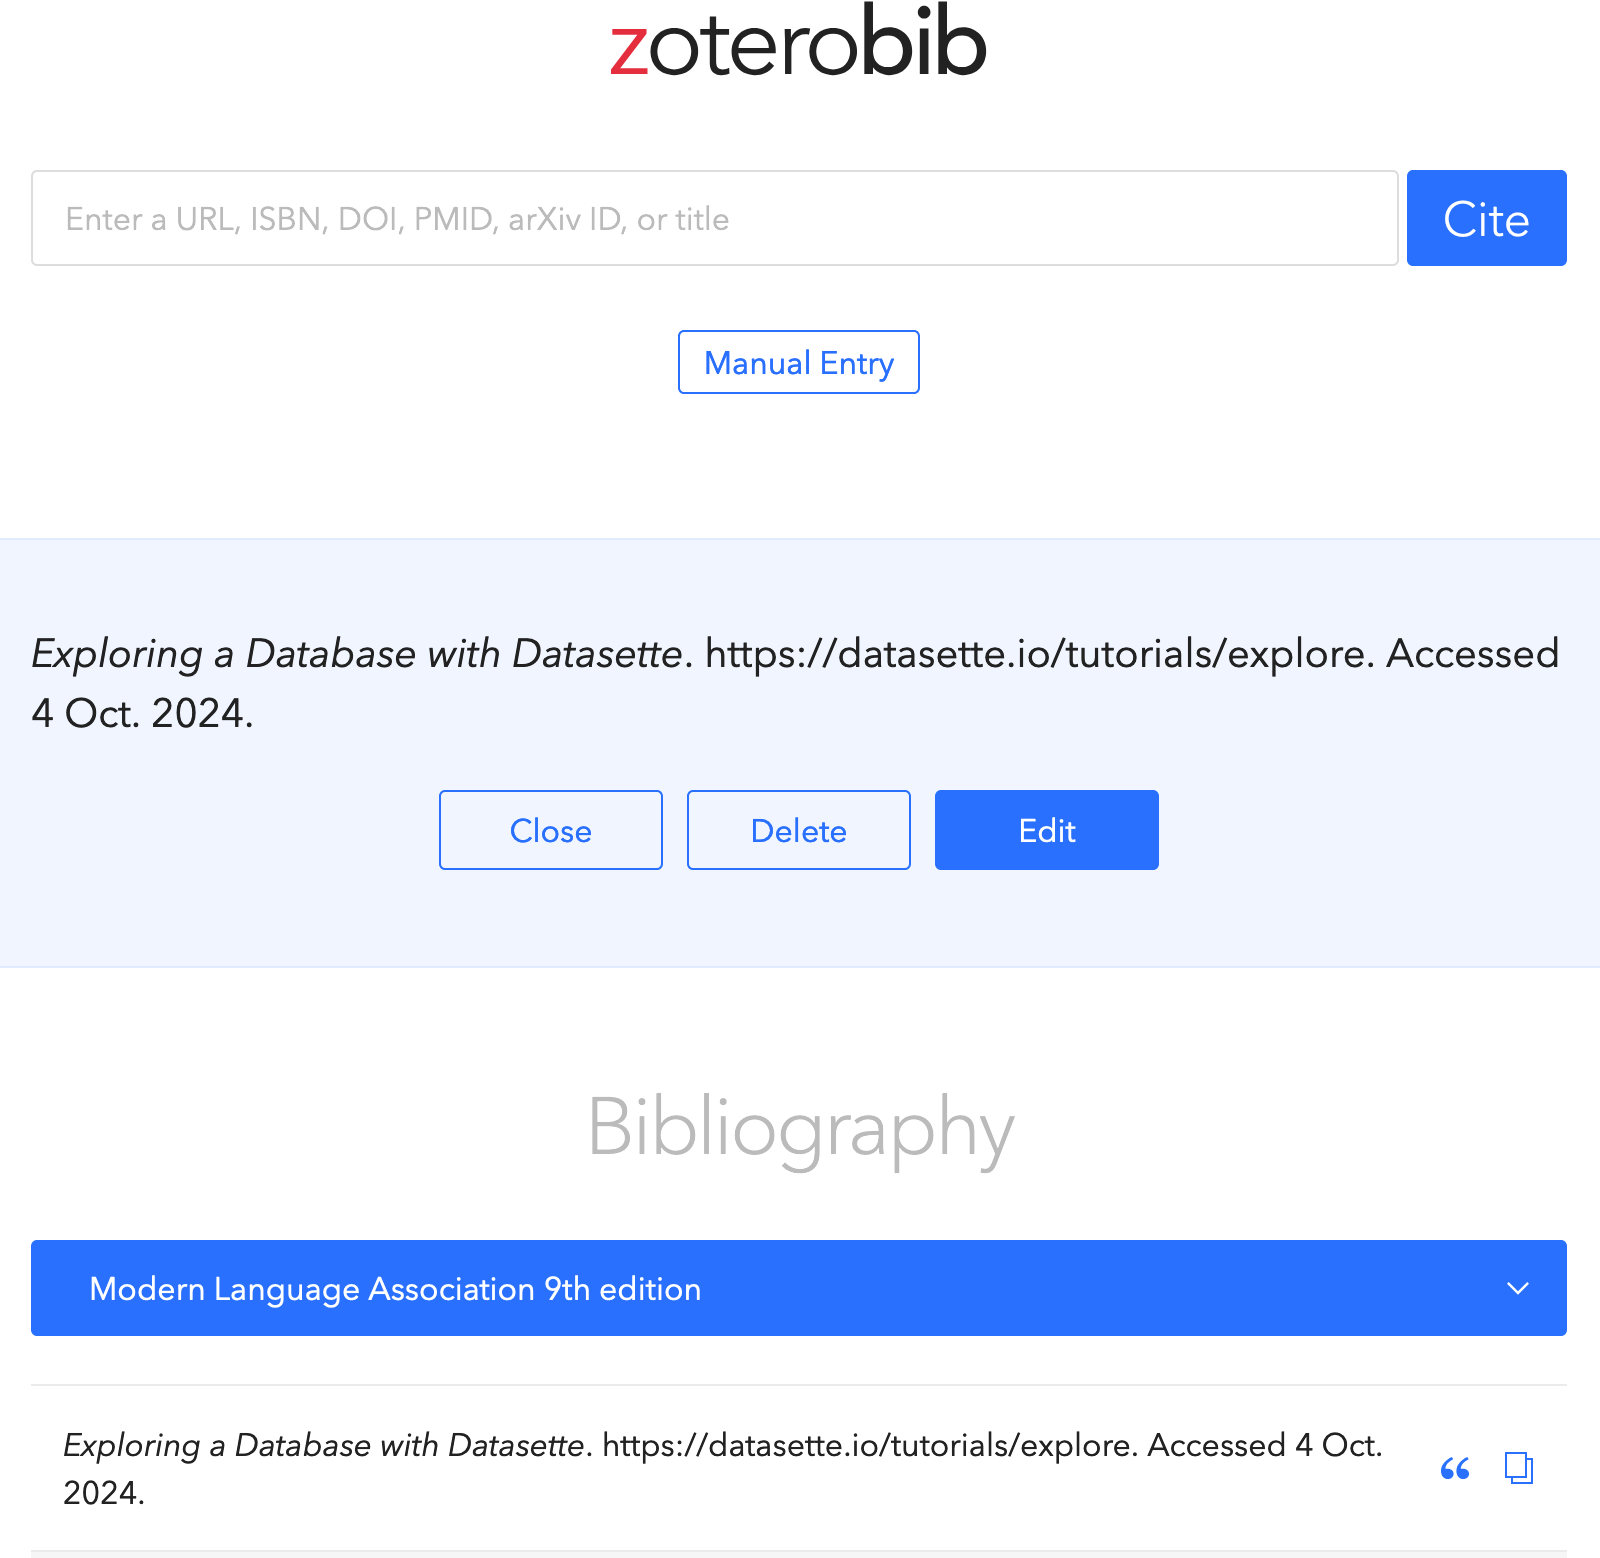
To make citing easier, you can use online tools like https://zbib.org/. Just enter the URL or information about your source, and it will generate a citation for you. Remember to double-check the generated citations, as they might need some adjustments.
Always check with your teacher about which citation style they prefer for your assignments. The most important thing is to include enough information so that someone else can find your source.